
It’s no secret: Crime in Chicago has been an incredibly hot topic during the last few years. The local and national spotlight has been on the city for everything from isolated violence, to the police department’s disconnect with Chicago residents, to the Laquan McDonald murder and Mayor Rahm Emanuel’s handling of it. With a new mayor soon as well as a new mix of aldermen, and with early 2019 homicide numbers comparatively better than the past few years, things may be modestly improving in the city.
Today, I’m taking a 10,000-foot-view of crime in Chicago, specifically how it overlaps with environmentally burdened areas, as indicated by the Natural Resources Defense Council. In my past two articles, I’ve addressed some of the neighborhood crossover (or lack thereof) of environmental hardships in the City of Chicago with transportation and educational hardships. I observed some inequities across the city, as expected, but was surprised by a few other findings.
Here, I only intend to look at where crimes occur, and not how crimes are treated/investigated by city officials and law enforcement after they occur. Neighborhoods with heavy volumes of reported crimes, it’s safe to say, experience more hardships than low-crime neighborhoods. By simply comparing the NRDC map with a crime-locations map, I intend to see where residents who already have one hardship may be prone to another, as I did with transportation and education.
As with education, I know there are many socioeconomic influences that factor into the overall living quality of a neighborhood and whether a specific area is more likely to experience crime. That said, research has shown that isolated crime can permeate perception of a whole neighborhood or broader area of the city (e.g. ask any white person who grew up in the suburbs what they think of the south side of Chicago, and chances are you’ll get mostly unfavorable answers). Rather than paint a whole part of the city with one brush, I want to see where the crime data takes me.
Crime and Environmental Burden
I first looked at the official data from the City of Chicago’s website. The official data allows users to map out all of the crimes committed across the city, down to the block and more. However, the mapping function is not conducive to a large comparative screen shot of the entire city, as the entire city appears in red, giving the impression that the entire city has an extensive crime problem. Even locating the map at specific neighborhoods can offer a confusing visual. Thus, I’m using unofficial data from the Chicago Police Department’s Citizen Law Enforcement Analysis and Reporting Map (CLEARMap) application. The CLEARMap data still provides a good picture of general crime locations and types of crime during the past 12 months, though it definitely lacks aesthetics. I just have to say, this is another reminder that I need to hone my own map-creation skills using raw data.
With the CLEARMap application, I filtered by community area and screened on both index* and non-index** (i.e. less violent) crime. I also screened on homicide, as that is the headline crime statistic. One caveat, the Chicago Police data is only a record on reported crime, which, given accusations of police targeting minorities, has the potential to be slightly skewed compared with other parts of the city if those accusations are valid. In addition, this data does not reflect the unreported crimes in the city. Also, I’m unable to focus on the “justice” aspect here because, though a crime has been reported, it does not mean that justice has been served.
Below are the NRDC map and the police data maps.
Environmental Burden

Source: NRDC
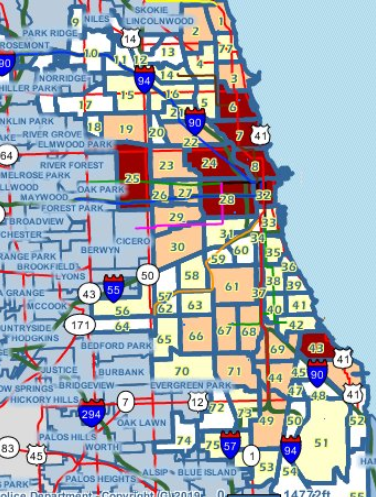
Index Crime
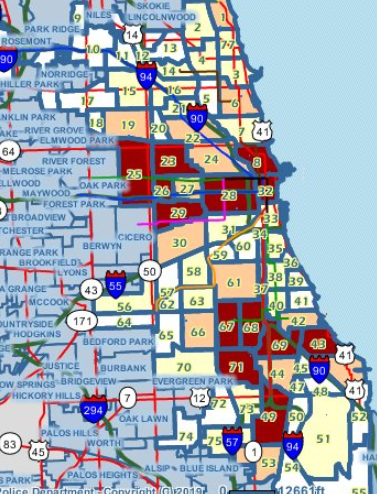
Non-Index Crime
Homicides

Crime Map Sources: Gis.ChicagoPolice.org CLEARMap
It was interesting seeing the crime data on its own, as the top two neighborhoods for index crime were the Near North Side and the Loop. I don’t think these areas are perceived to be particularly “dangerous,” but given the concentration of people (e.g. workers and tourists) and businesses in these areas, this isn’t a surprise. In fact, the Near West Side, Lincoln Park, and Lake View are all in the top 10, certainly not the neighborhoods that some “politicians” are referring to when they say crime in Chicago is “out of control.”
Getting back to the comparison with the NRDC map, because I don’t have specific community area information on where the environmental burden is worse, I am making my unprofessional comparison by looking the heat effects of both the NRDC’s map and the CLEARMaps.
First, let’s take a look at index crime. North Lawndale, the Near West Side, and South Chicago generally have higher environmental burdens and also higher rates of index crime. But the other neighborhoods with the environmental burden (such as Irving Park, Avondale, Archer Heights, and McKinley Park) are in the bottom half of crime volume. So while some neighborhoods are afflicted with the double burden of crime and environmental hardship, others aren’t
For non-index crime, the heat map shifted more to the west and south sides, which have more exposure to the environmental burden. So the crossover in these areas is stronger, and these residents have the compounding burden. Still, as with index crime, while certain neighborhoods experience double hardships, others generally have only elevated crime or environmental burdens, but not both.
Interestingly, the homicide map is closely similar to the non-index crime map, which of course is a little surprising considering homicides are an index crime.
Correlations and Policy Guidance
Although I am familiar with which community areas tend to have more reported crimes, as shown on the maps above, I have to admit I was expecting more of a correlation between environmental burden and reported crime, given previous analysis on a such a correlation. Recently, more studies have been published, such as a joint analysis from the University of Michigan, Columbia, and Harvard on the connection between pollution and unethical behavior.
The London School of Economics also found a positive correlation and indicated “that improving air quality in urban areas by tighter environmental policy may provide a cost-effective way to reduce crime.” Notably, though the LSE’s researchers didn’t necessarily find a link between pollution and violent crimes, they did find “positive and significant effects of air pollution on the number of offenses for which punishment is less severe.” The report points to pickpockets in London as an example, but given the stronger crossover of non-index crimes and environmental burden in Chicago, perhaps the LSE’s finding is relevant in the Windy City, too.
So, how can Chicago policymakers seek to ensure that pollution and crime don’t doubly afflict their communities? As I mentioned in my first article addressing the NRDC map, it may be difficult to have current polluters change their tack, and the expressways that dissect the city further add to the environmental burden. Many residents cannot afford to live in other parts of the city and also are closely tied to their current communities, regardless of environmental and crime hardships. There is no easy solution by any means.
Last year, Jens Ludwig of the University of Chicago’s Crime Lab reported on a drop in homicide rates in many parts of the city in 2017 and pointed to the implementation of Strategic Decision Support Centers (i.e. data-driven policing and rethinking police practices rather than adding headcount) contributing to the decline in certain communities. Ludwig noted that it is uncertain that SDSCs will be as effective in other parts of the city, and that Chicago’s segregated population and Illinois’ below-average education spending are hindrances to reducing crime. As I mentioned earlier, there are many, many socioeconomic factors that go into the crime formula, and unfortunately my lack of expertise here requires much more research for me to better get a grasp on the big picture, both on crime in general and the relationship between crime and pollution in the city.
For now, I think that both analyses from the LSE and U of C are informative and essential reads for Mayor Lightfoot/Preckwinkle and the next city council. (Hey, they’re really quick reads; there’s no reason they can’t take five minutes!)
It’s an audacious undertaking to alleviate the environmental and crime burdens in the city. But by taking the issue head on and heeding advice from the experts who research these matters, Chicago can position itself and remind people that it is the City of Broad Shoulders and not the punchline City With Problems.
Headline Photo by kat wilcox from Pexels
* Index Crime:
- Homicide 1st & 2nd degree
- Criminal sexual assault
- Robbery
- Aggravated assault
- Aggravated battery
- Burglary
- Larceny
- Motor vehicle theft
- Arson
** Non-Index Crime:
- Involuntary manslaughter
- Simple assault
- Simple battery
- Forgery & counterfeiting
- Fraud
- Embezzlement
- Stolen property
- Vandalism
- Weapons violation
- Prostitution
- Criminal sexual abuse
- Drug abuse
- Gambling
- Offenses against family
- Liquor license
- Disorderly conduct
- Miscellaneous non-index offense
